Finance · Finance
Profit & Loss Statement

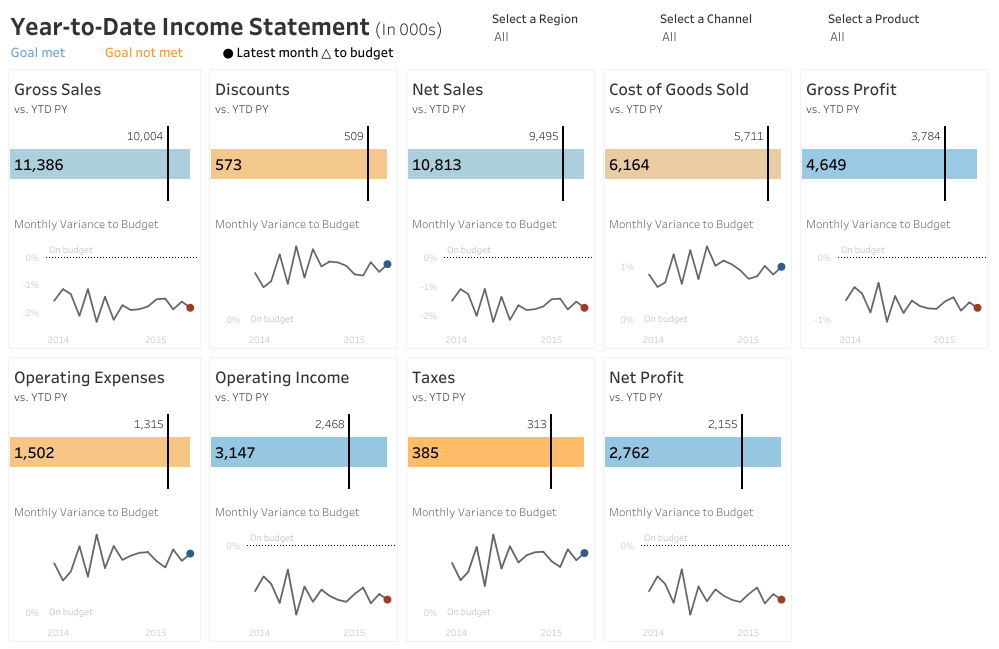
Visualize the current year’s profit and loss metrics while comparing them to the prior year, and analyze monthly performance against the previous month. This statement tracks key figures such as revenue, gross and net profit margins, expenses, and financial ratios like Quick and Current, giving finance managers a clear view of financial health and performance trends.
Questions this dashboard answers
- What is the company's current revenue, gross profit, and net profit for the year?
- How do operating expenses and cost of goods sold compare to revenue?
- What are the company's current ratio and quick ratio, and what are the accounts receivable and payable compared to the prior month?
At a glance
Built withTableau
SectorFinance
Views41
Published2026
wealthbanking
Powered by Tableau
Questions this dashboard answers
- What is the company's current revenue, gross profit, and net profit for the year?
- How do operating expenses and cost of goods sold compare to revenue?
- What are the company's current ratio and quick ratio, and what are the accounts receivable and payable compared to the prior month?
At a glance
Built withTableau
SectorFinance
Views41
Published2026
wealthbanking