Finance · Finance
Financial Overview

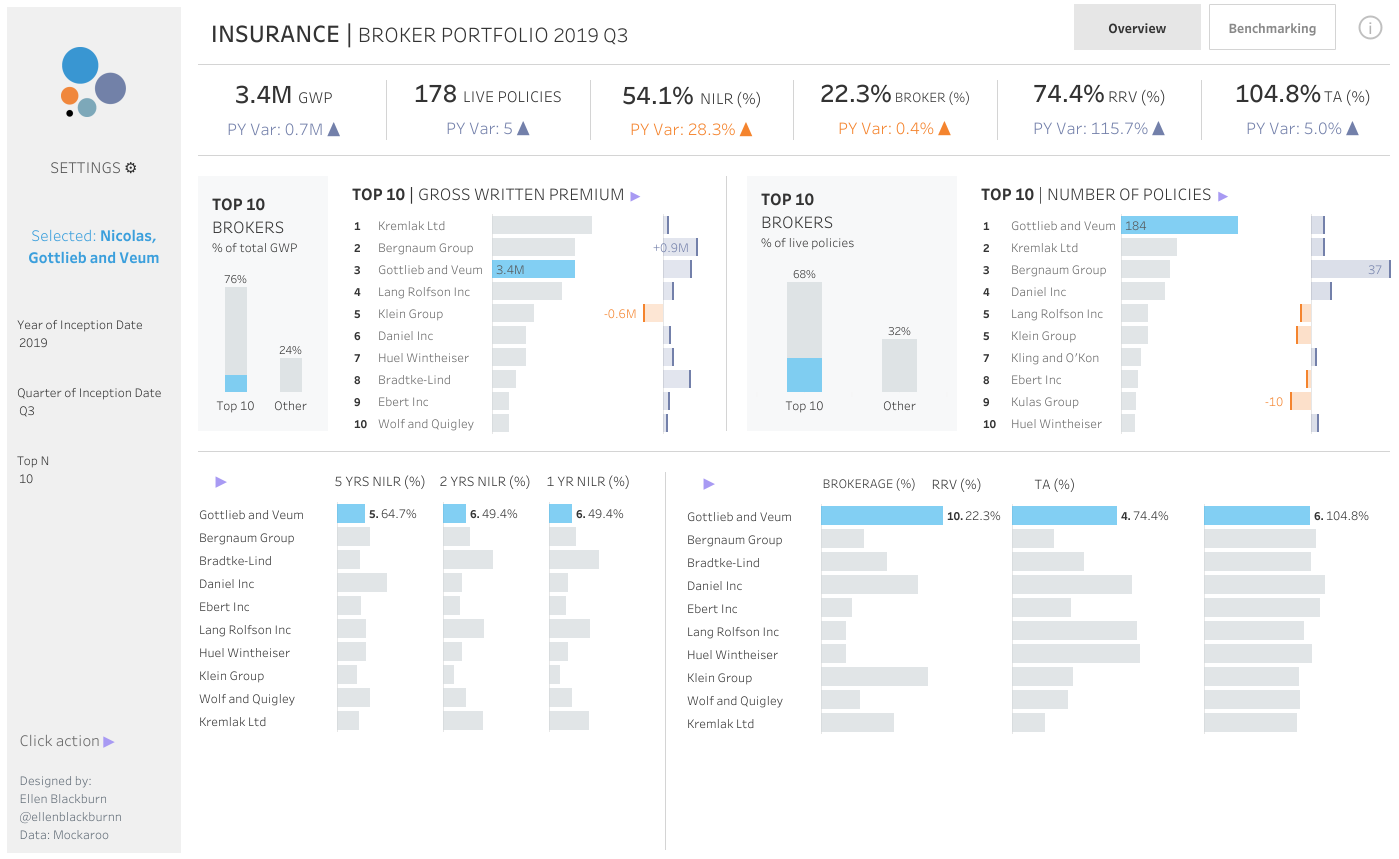
This dashboard provides a financial overview of policy performance featuring a Sankey diagram that visualizes the flow of policies through a volume funnel from new business to inception, renewal, and lapsed status. This tool is invaluable for financial analysts and portfolio managers to understand policy retention, identify leakage points, and optimize strategies for improving renewal rates and overall financial health.
Questions this dashboard answers
- Where in the policy funnel are the largest drop-off points: between quote and acceptance, or between acceptance and inception?
- What is the year-over-year change in the total amount of renewal quotes, specifically comparing 2020 to the two prior years?
- How has policy retention rate trended over the last three years?
At a glance
Built withTableau
SectorFinance
Views179
Published2026
financeinsurance
Powered by Tableau
Questions this dashboard answers
- Where in the policy funnel are the largest drop-off points: between quote and acceptance, or between acceptance and inception?
- What is the year-over-year change in the total amount of renewal quotes, specifically comparing 2020 to the two prior years?
- How has policy retention rate trended over the last three years?
At a glance
Built withTableau
SectorFinance
Views179
Published2026
financeinsurance