Finance · Finance
KPI Overview

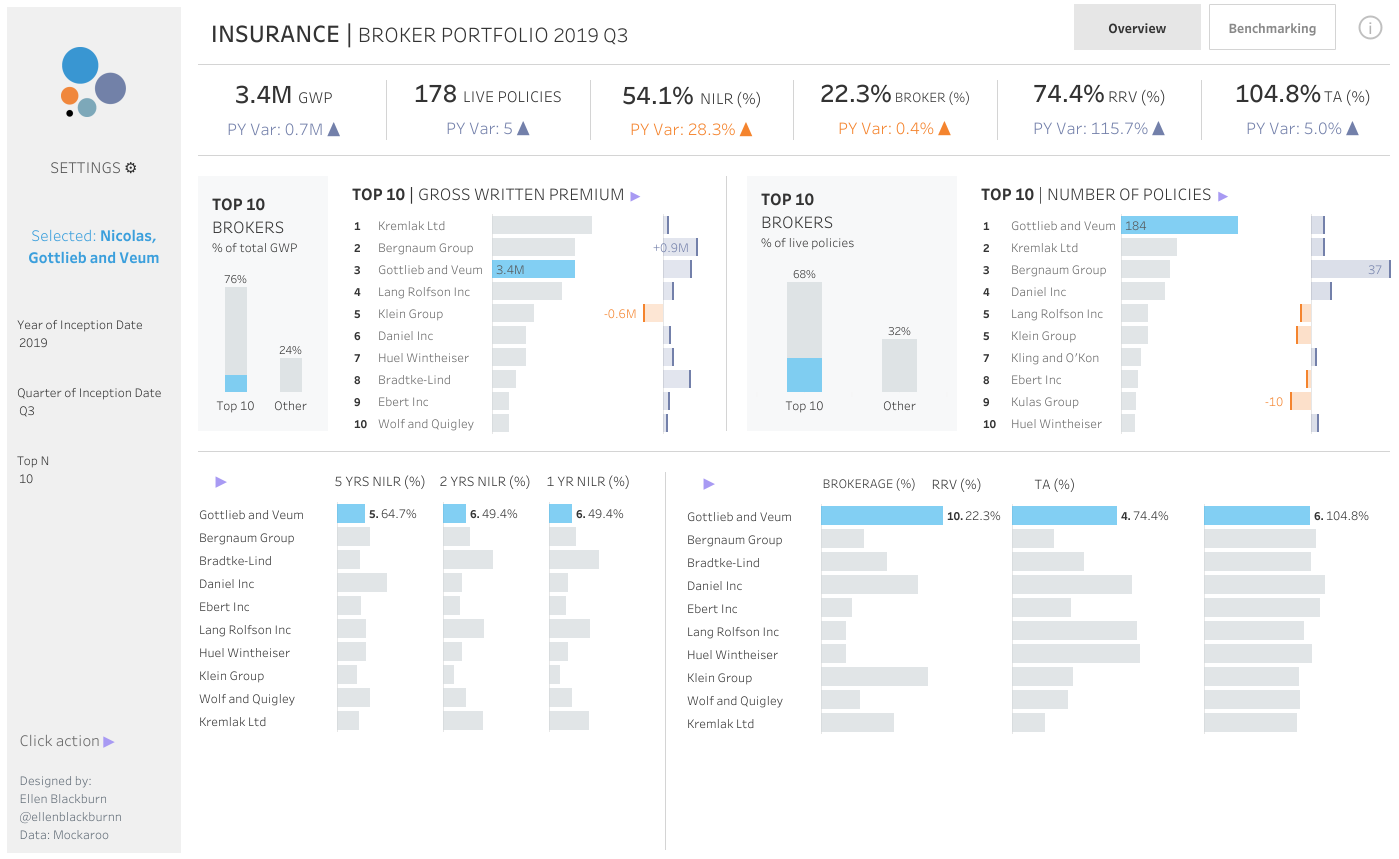
This dashboard provides a high-level overview of key performance indicators for an insurance company tracking metrics such as profit, new policies, acquisition costs, and percentage of brokerage. Managers can quickly monitor the financial health of the business, identify performance trends, and make data-driven decisions to optimize sales and manage costs.
Questions this dashboard answers
- What is the current profit to profit ratio, and how has it trended against the previous year?
- How did the acquisition costs for the content and legal departments compare to each other last month?
- How many new insurance policies were sold this month compared to last month?
At a glance
Built withTableau
SectorFinance
Views89
Published2026
financeinsurance
Powered by Tableau
Questions this dashboard answers
- What is the current profit to profit ratio, and how has it trended against the previous year?
- How did the acquisition costs for the content and legal departments compare to each other last month?
- How many new insurance policies were sold this month compared to last month?
At a glance
Built withTableau
SectorFinance
Views89
Published2026
financeinsurance