Finance · Finance
Integrated Trading & Credit Dashboard for Sustainability

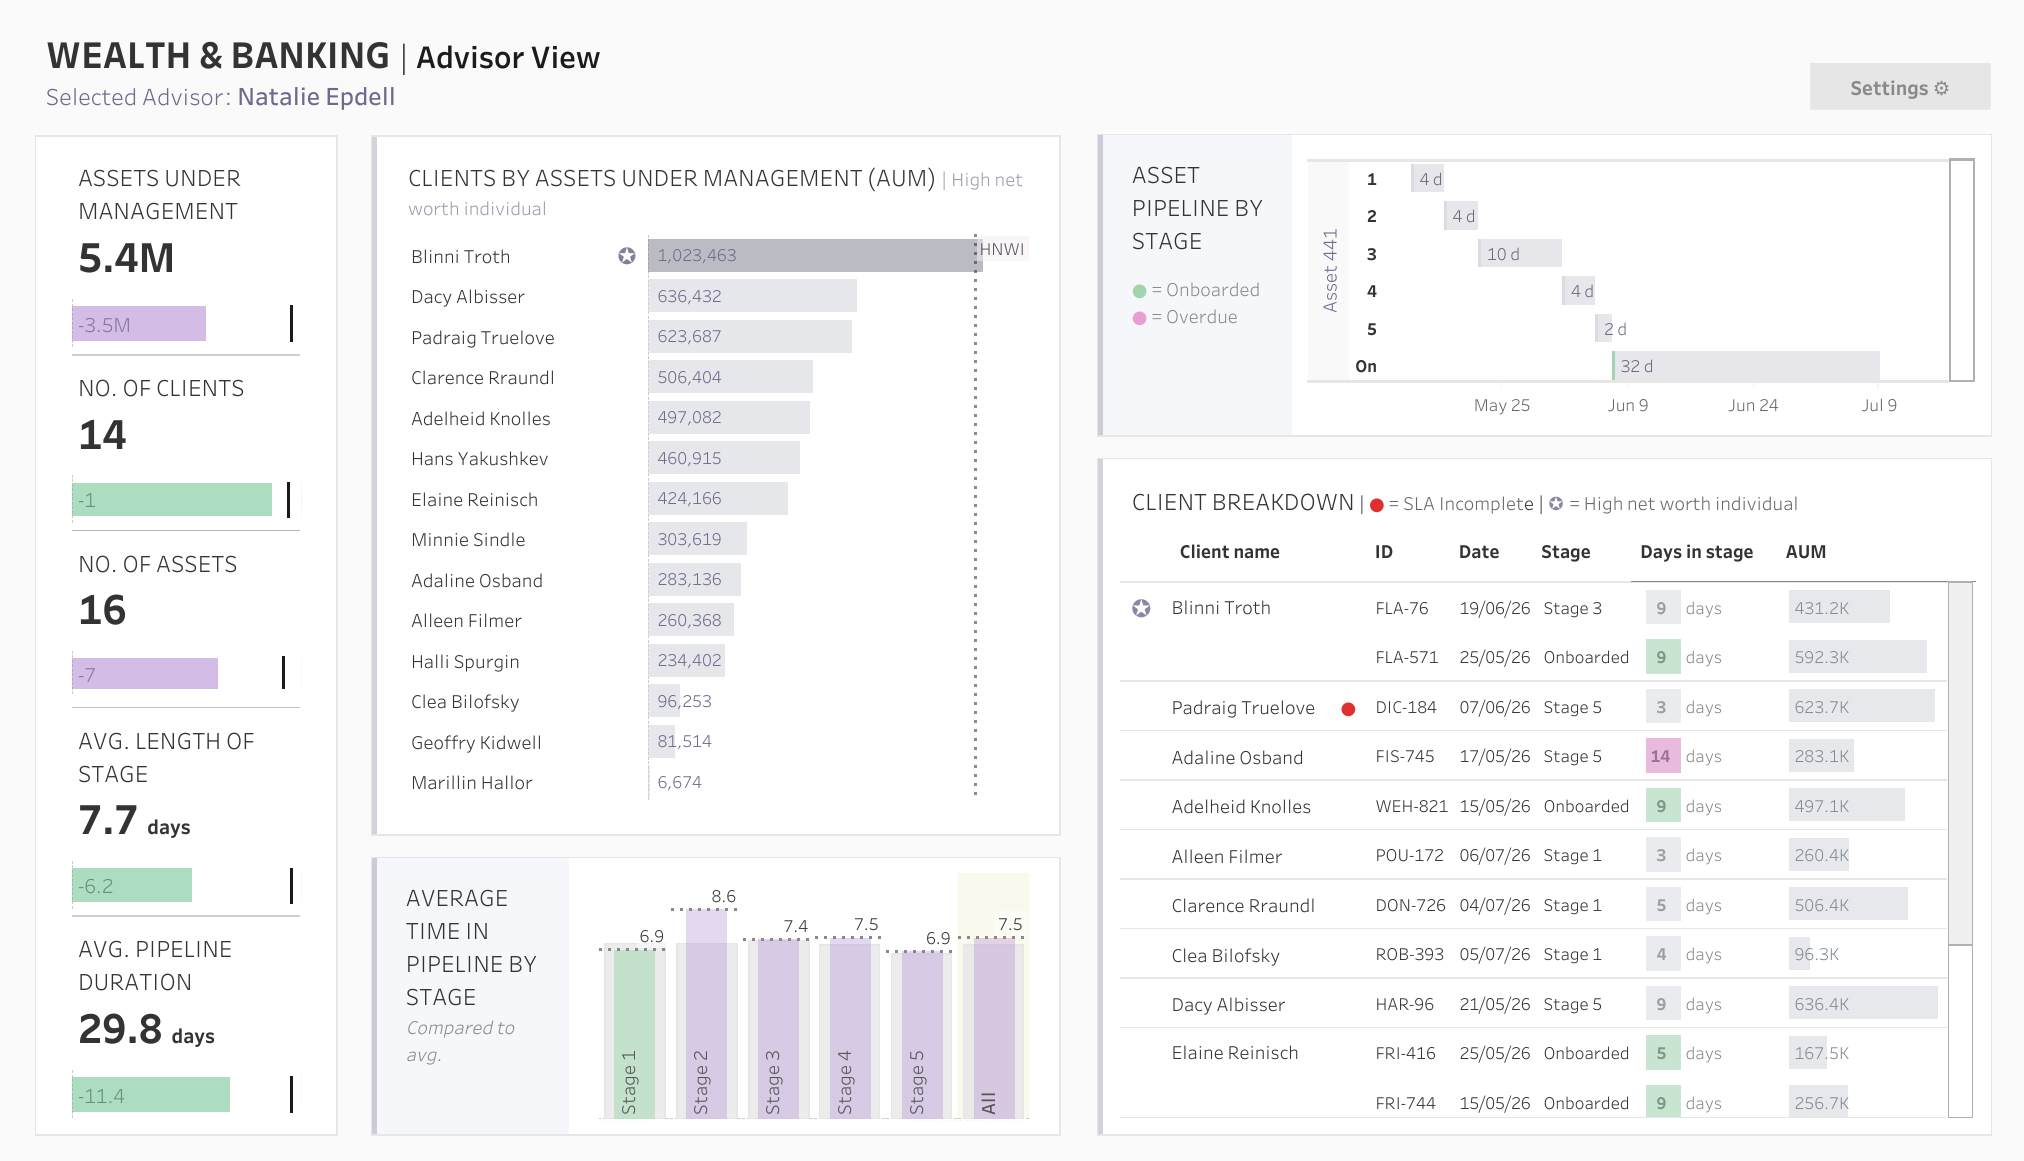
This essential dashboard equips sales managers with powerful tools to monitor trading positions within their respective oil sales areas over time. It integrates critical statistics such as Value at Risk (VaR), Fiscal Year Profit & Loss (P&L FY), expiration date information, and Day-Over-Day Move metrics, alongside other vital reporting data. By consolidating these key insights, managers are empowered to make confident, strategic decisions, thereby optimizing their trading performance and fostering sustained success.
Questions this dashboard answers
- How do our oil and natural gas positions compare across different locations?
- How has our overall trading performance and Profit & Loss evolved over the last few months?
- How are our current trading positions distributed across future expiration dates?
At a glance
Built withTableau
SectorFinance
Views38
Published2026
financetradingESG
Powered by Tableau
Questions this dashboard answers
- How do our oil and natural gas positions compare across different locations?
- How has our overall trading performance and Profit & Loss evolved over the last few months?
- How are our current trading positions distributed across future expiration dates?
At a glance
Built withTableau
SectorFinance
Views38
Published2026
financetradingESG