Sport · Sport
Bayern Munich v Chelsea Scout Report

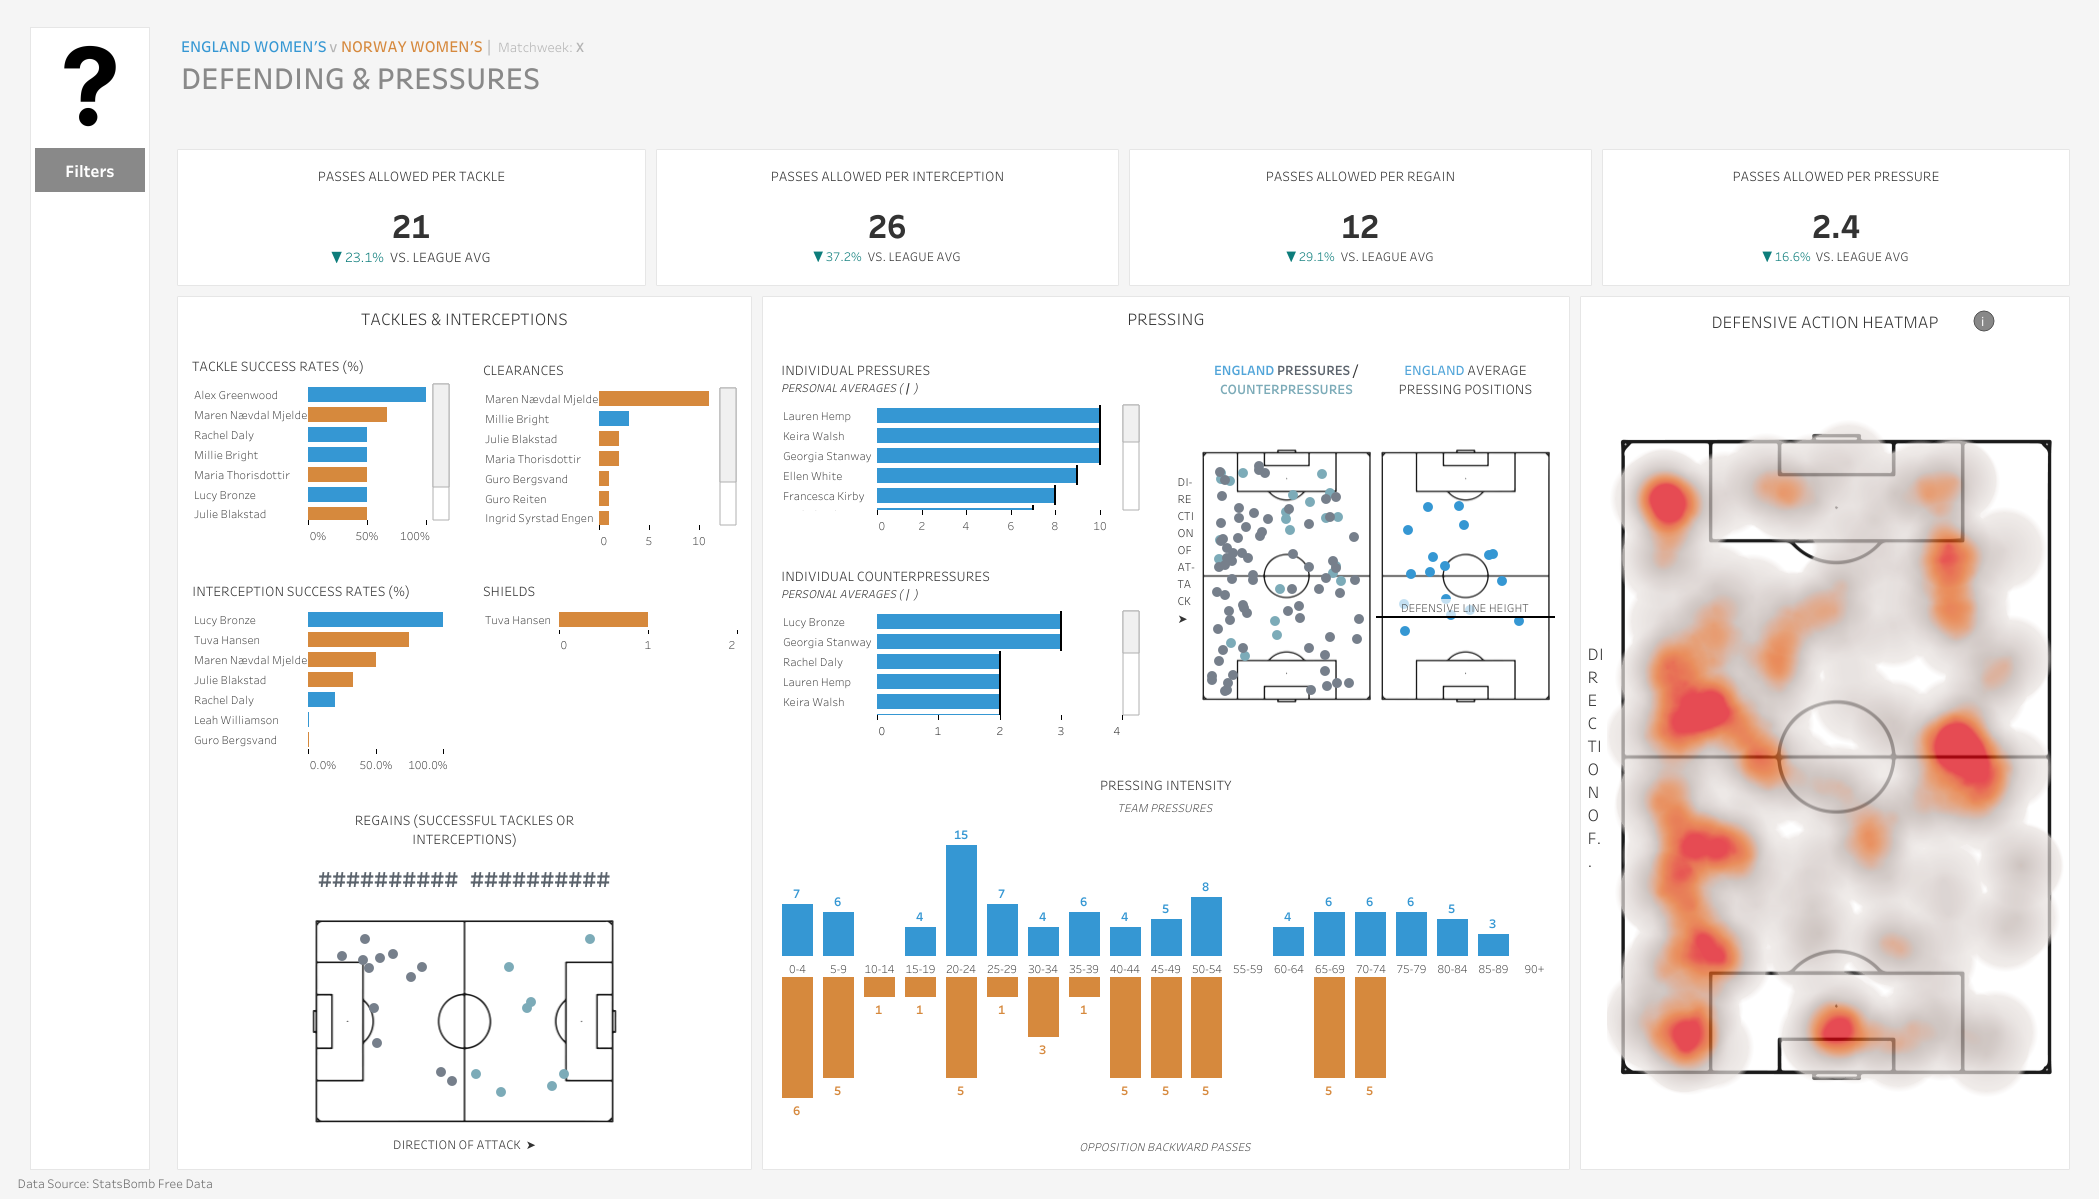
This dashboard demonstrates Tableau’s capabilities for post-match analysis at the team level, including heatmaps, passing patterns for individual players, and shooting performance. It also visualizes team formations and provides breakdowns for both sides, giving coaches and analysts insights into tactics, opponent weaknesses, and areas to inform future game planning.
Questions this dashboard answers
- What was the final score of the match, and what formations did the teams use?
- What are the completed and incomplete passes by player?
- Where on the field did Bayern Munich and Chelsea take their shots, and how many shots on goal did each team have?
At a glance
Built withTableau
SectorSport
Views164
Published2026
football
Powered by Tableau
Questions this dashboard answers
- What was the final score of the match, and what formations did the teams use?
- What are the completed and incomplete passes by player?
- Where on the field did Bayern Munich and Chelsea take their shots, and how many shots on goal did each team have?
At a glance
Built withTableau
SectorSport
Views164
Published2026
football