Commercial · Sales Reporting
Sales Performance

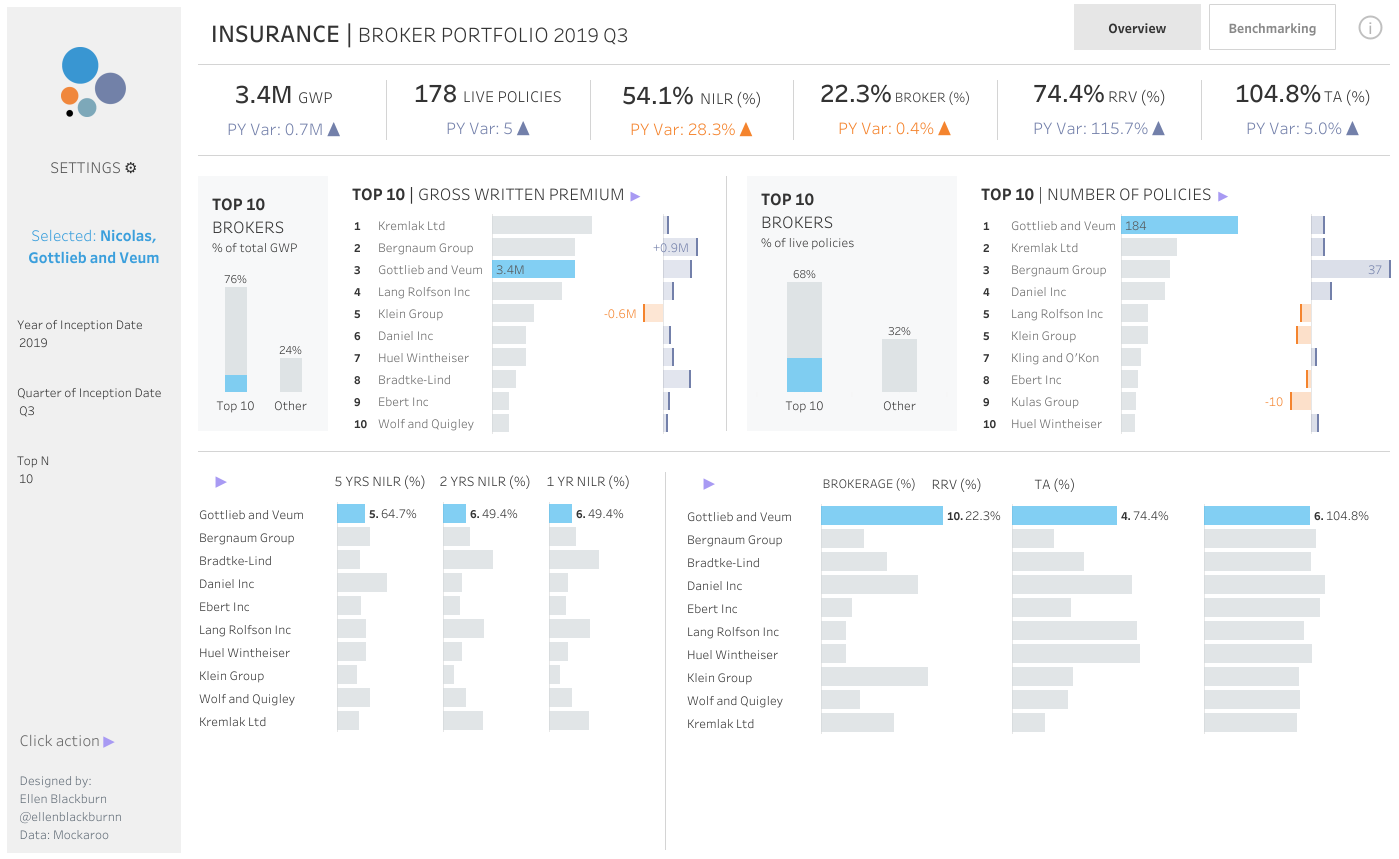
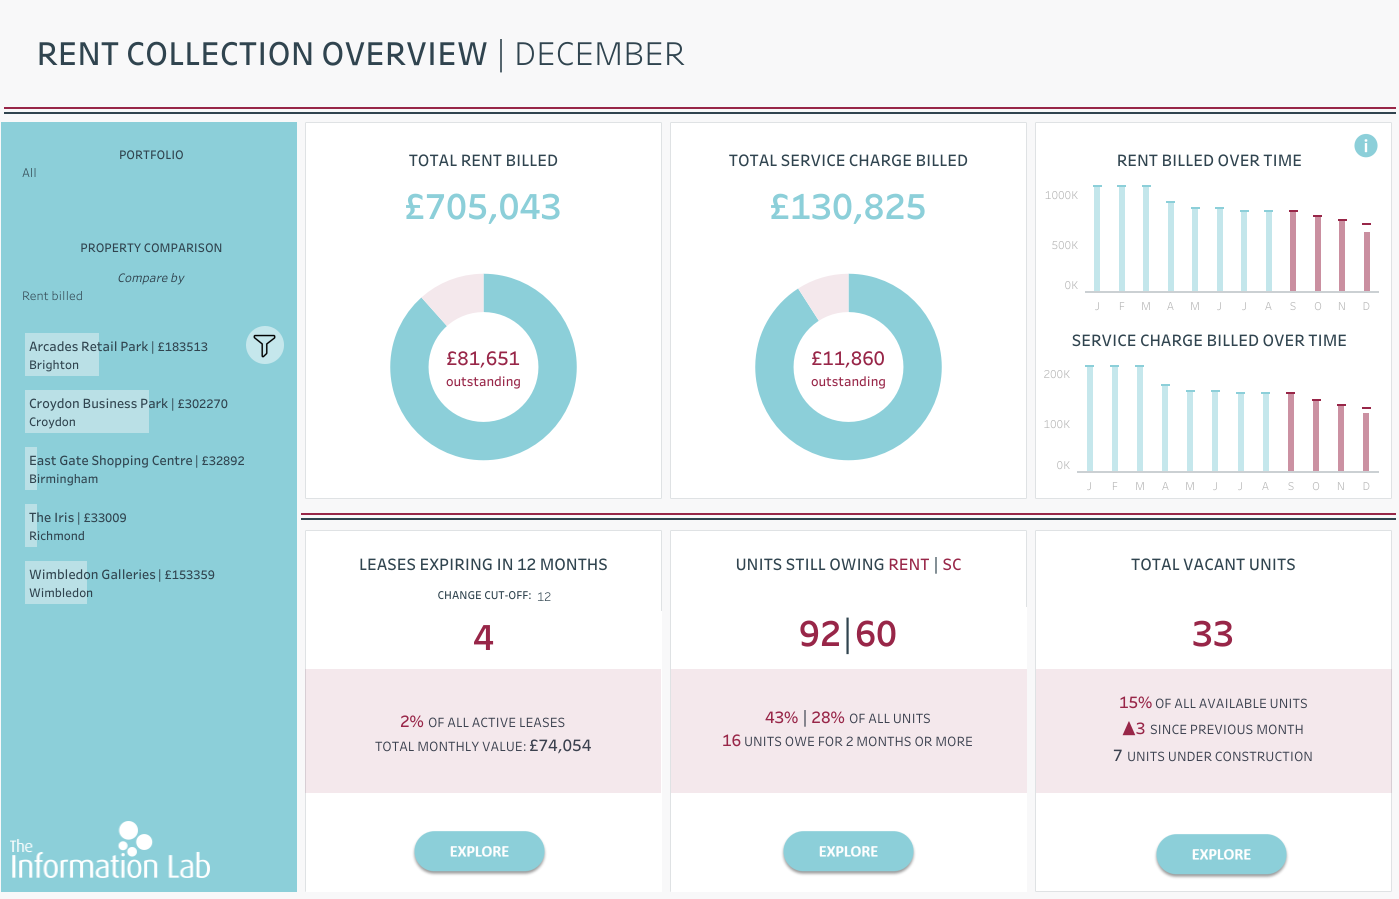
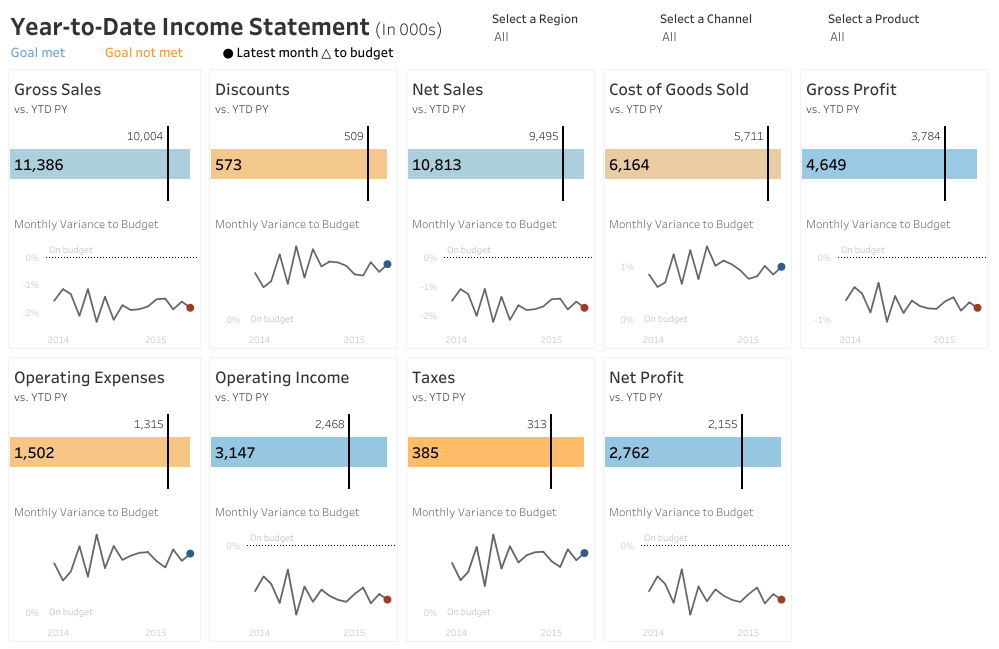
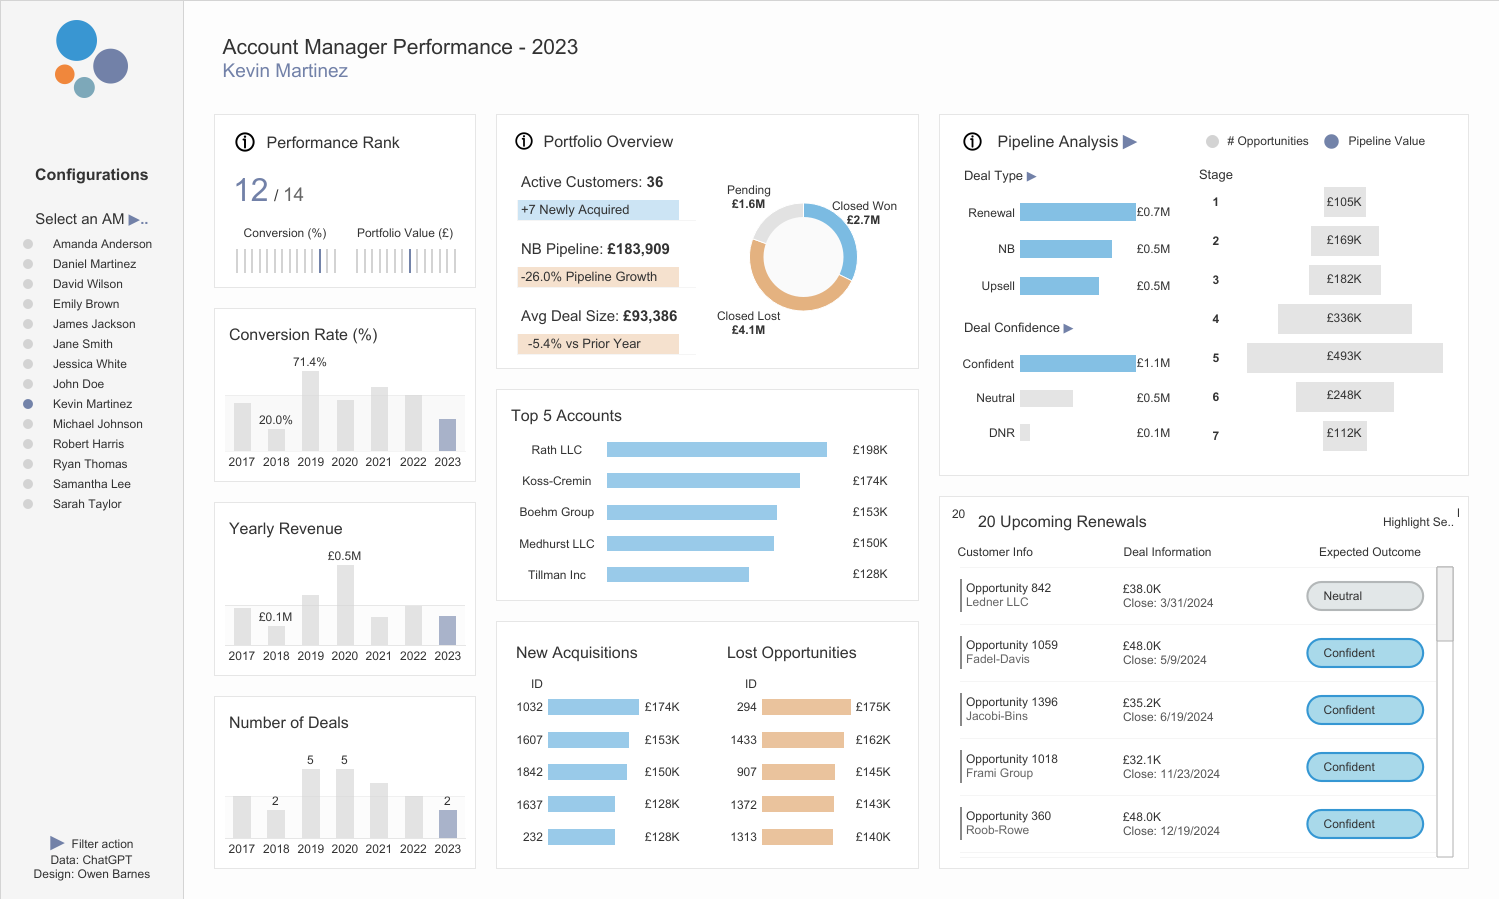
This sales performance dashboard provides a high-level view of revenue, profitability, orders, and customer activity over time. It allows users to filter performance by region, state, and order date, while comparing sales across product categories and customer segments. Detailed category and subcategory results make it easy to identify top performers, spot areas of low or negative profitability, and understand what is driving overall sales.
Questions this dashboard answers
- Which product categories and subcategories generate the most sales and profit?
- How have sales and profitability changed over time?
- Which customer segments, regions, or states are contributing the most to overall sales performance?
At a glance
Built withPower BI
SectorCommercial
Views10
Published18 Feb 2025
salesrevenueprofitability
Questions this dashboard answers
- Which product categories and subcategories generate the most sales and profit?
- How have sales and profitability changed over time?
- Which customer segments, regions, or states are contributing the most to overall sales performance?
At a glance
Built withPower BI
SectorCommercial
Views10
Published18 Feb 2025
salesrevenueprofitability