K-12 District Student Success Dashboard

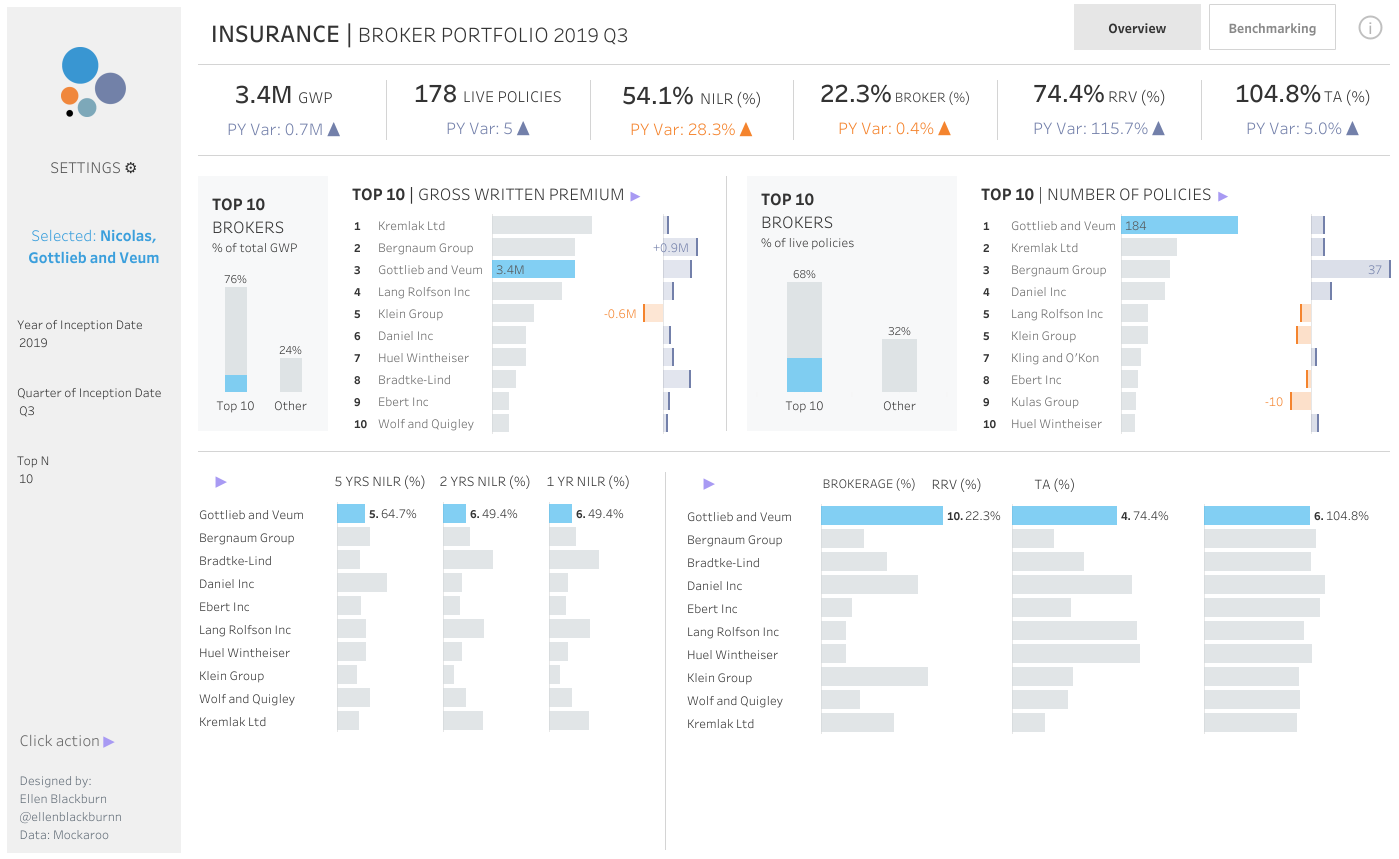
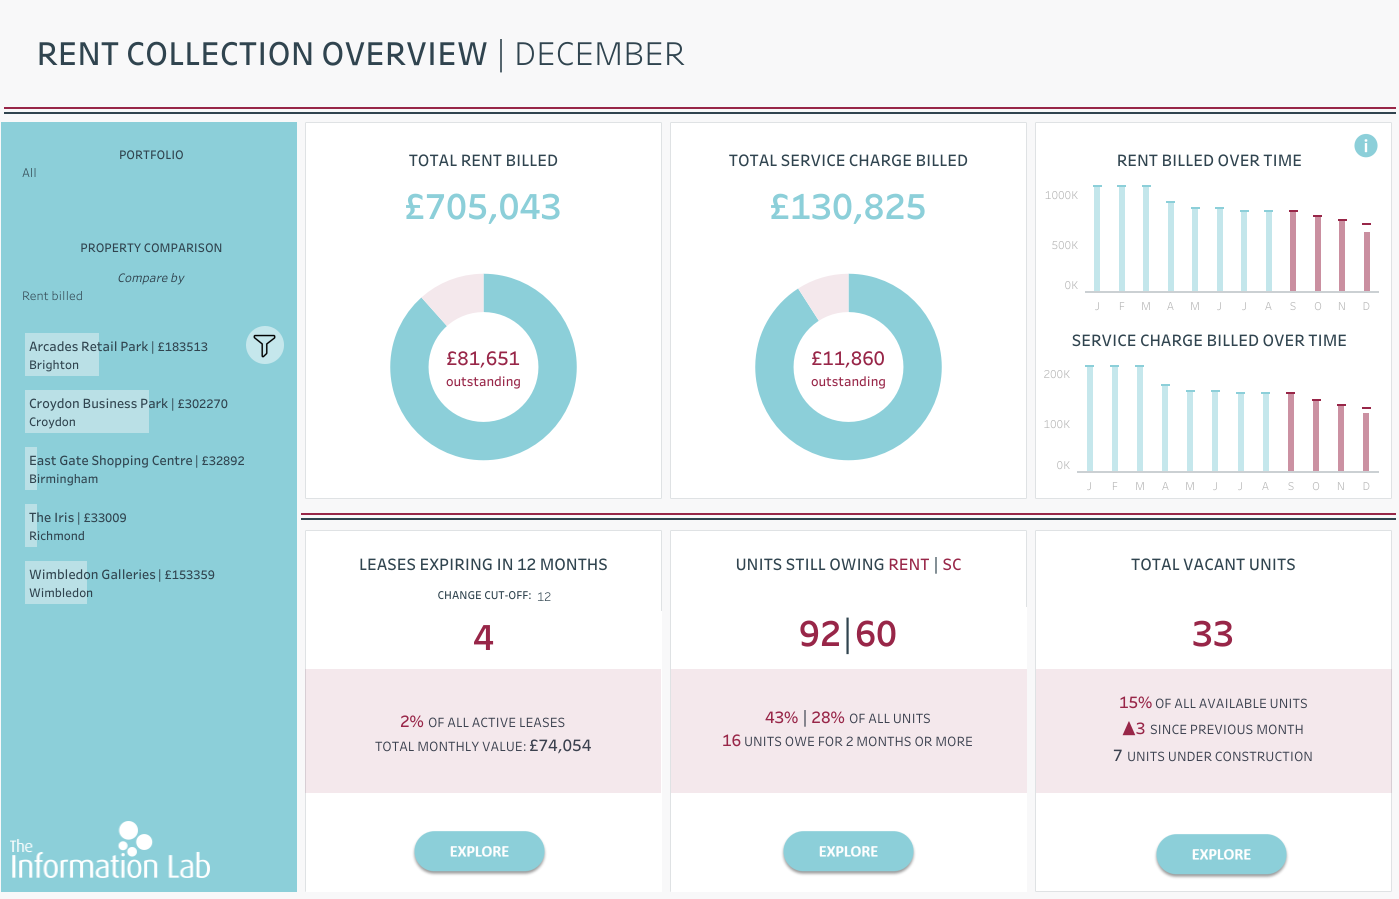
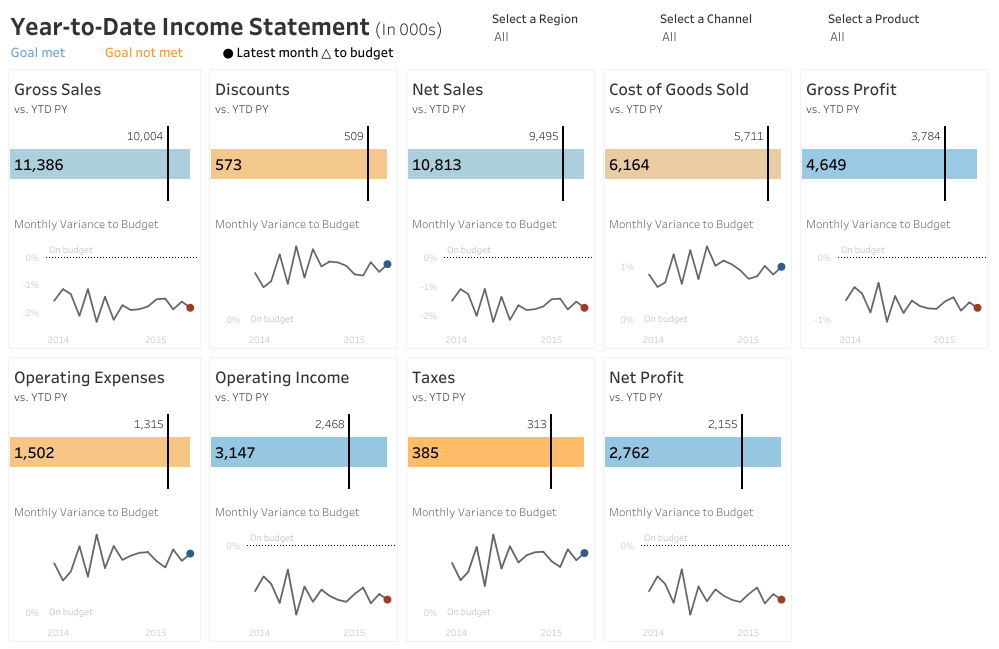
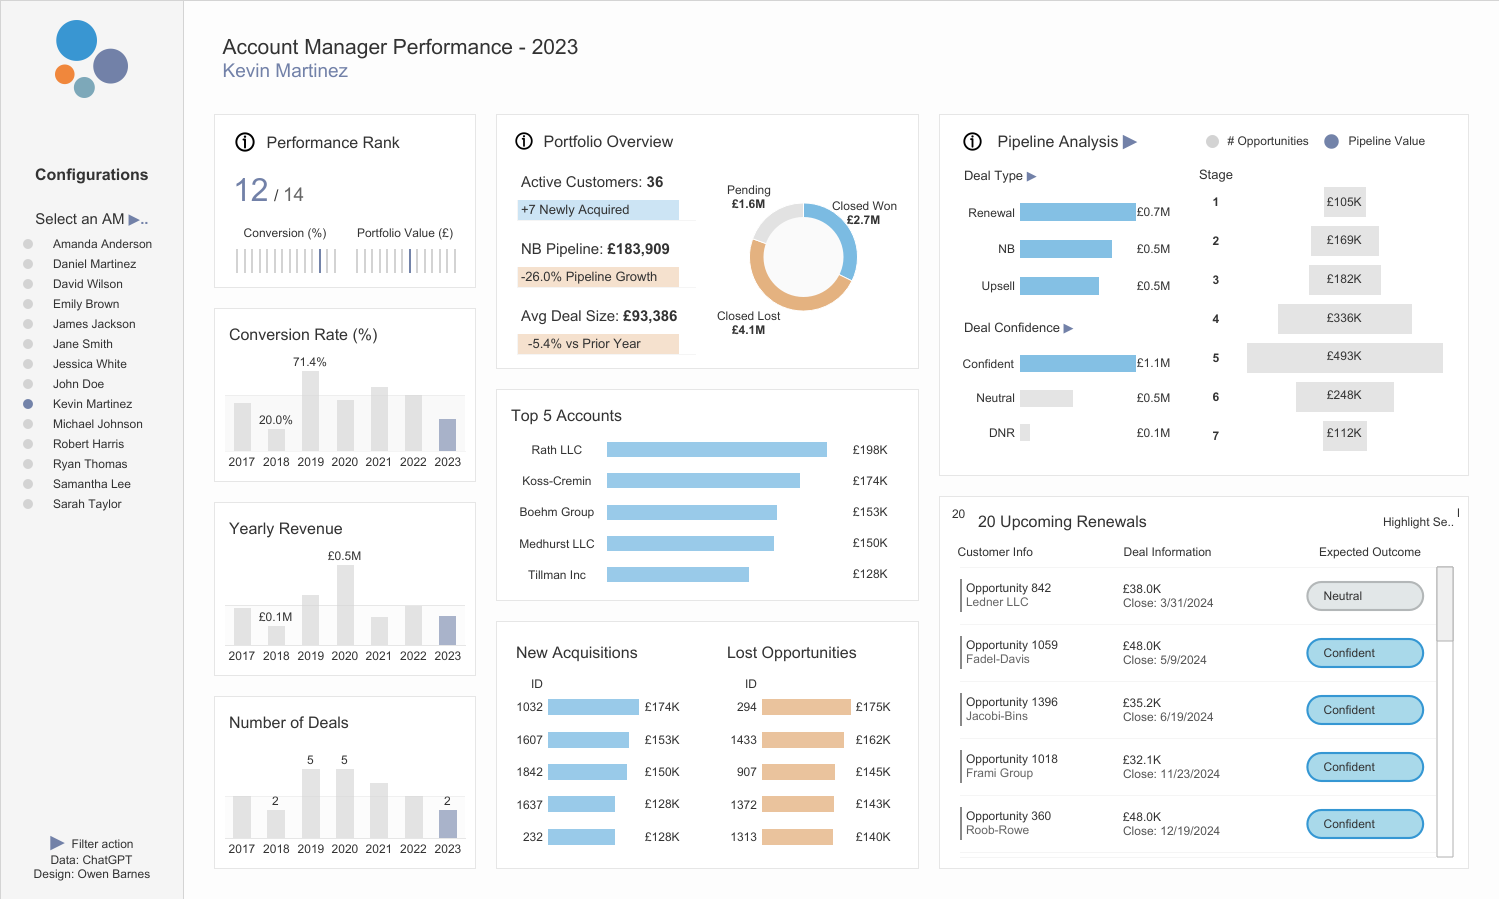
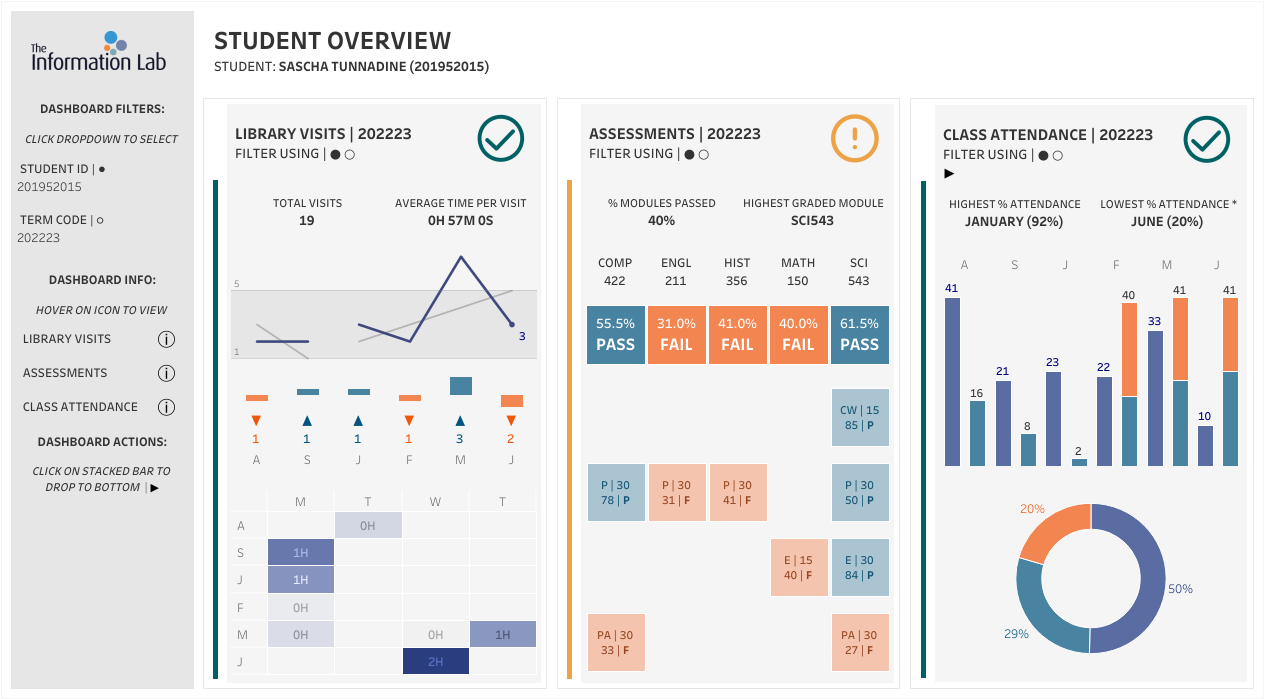
This dashboard gives district leaders and principals a connected view of enrollment, daily attendance, chronic absence and academic performance across every school in the district. It profiles each school’s student population (English language learners, students with disabilities, free lunch eligibility), tracks attendance patterns by month, weekday and absence type, flags chronic absence by school and zip code against the prior year, and links attendance to classes passed and performance tiers. Users can filter by school year, grade, school and student group, and set their own at-risk and chronic absence thresholds, so district administrators, principals and student support teams can see where students are falling behind and target interventions where they’ll matter most.
- Which schools and neighborhoods have the highest chronic absence rates, and how much have they changed since last year?
- How does a student’s attendance relate to the number of classes they’re passing and their performance tier?
- Are there particular months or days of the week when attendance drops, and is the rise in absences driven by excused or unexcused absences?
- Which schools and neighborhoods have the highest chronic absence rates, and how much have they changed since last year?
- How does a student’s attendance relate to the number of classes they’re passing and their performance tier?
- Are there particular months or days of the week when attendance drops, and is the rise in absences driven by excused or unexcused absences?